Research
Questions punters argue about, answered by counting. Each page says where its numbers come from and what they do not show. Its charts and data are free to use with a credit.
Updated regularly
-
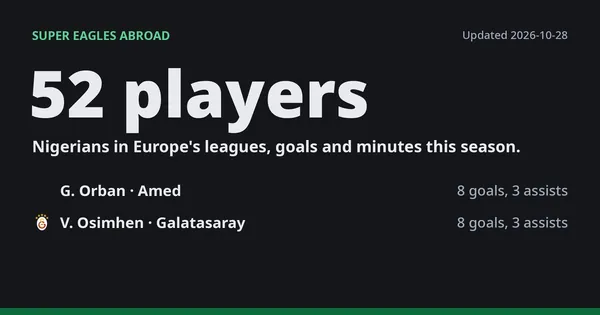 Updated weekly · Super Eagles abroad →
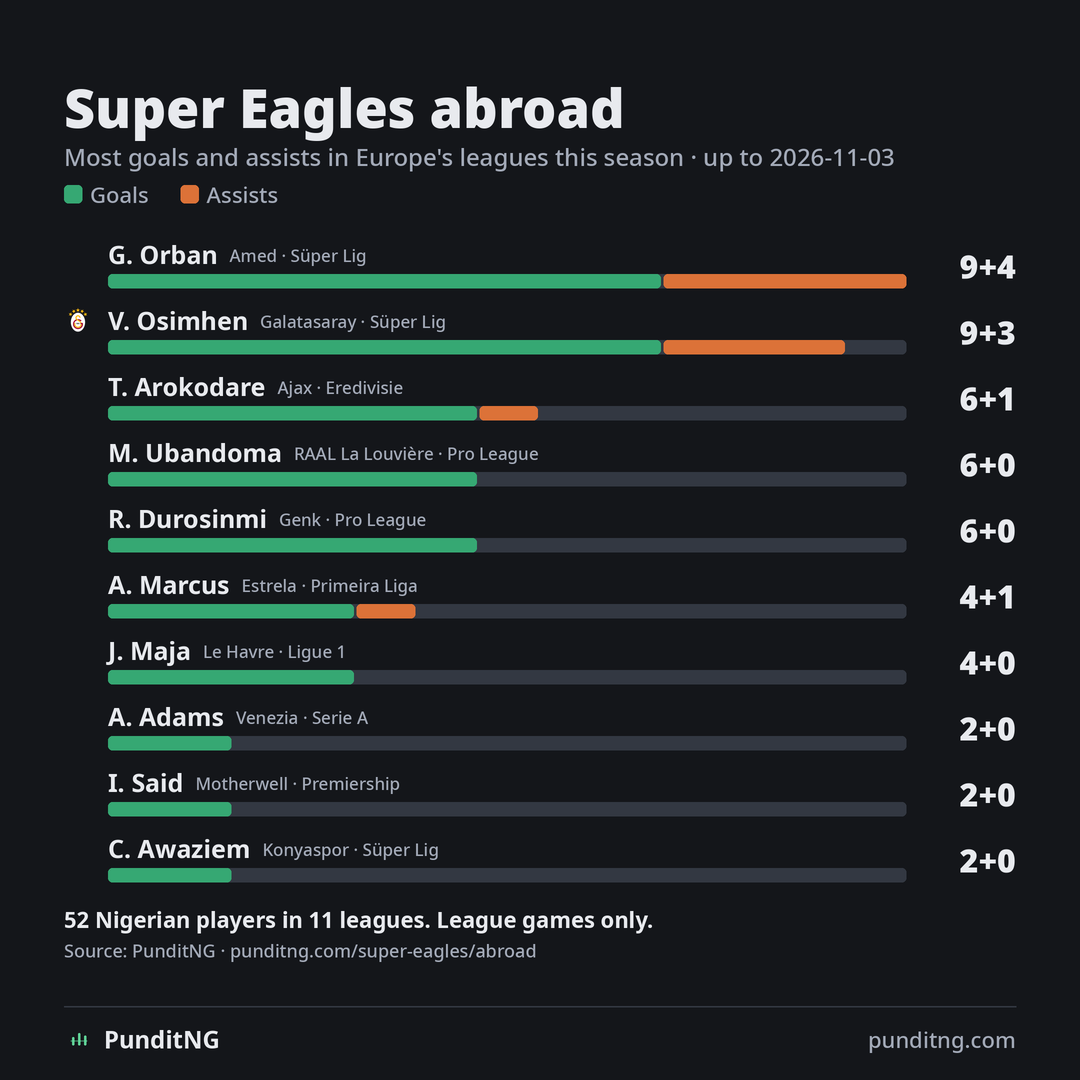
Goals, assists and minutes for every one of them, league by league, and who scored this week.
Download: Top 10 chart
-
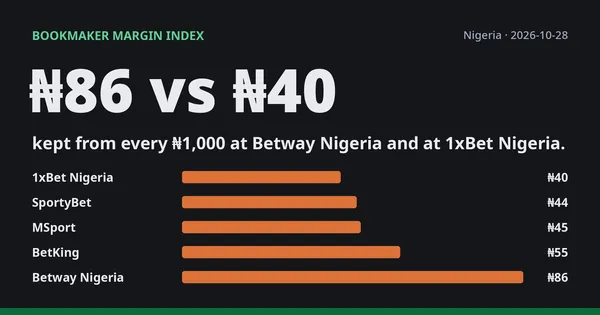 Updated daily · Bookmaker margin index →
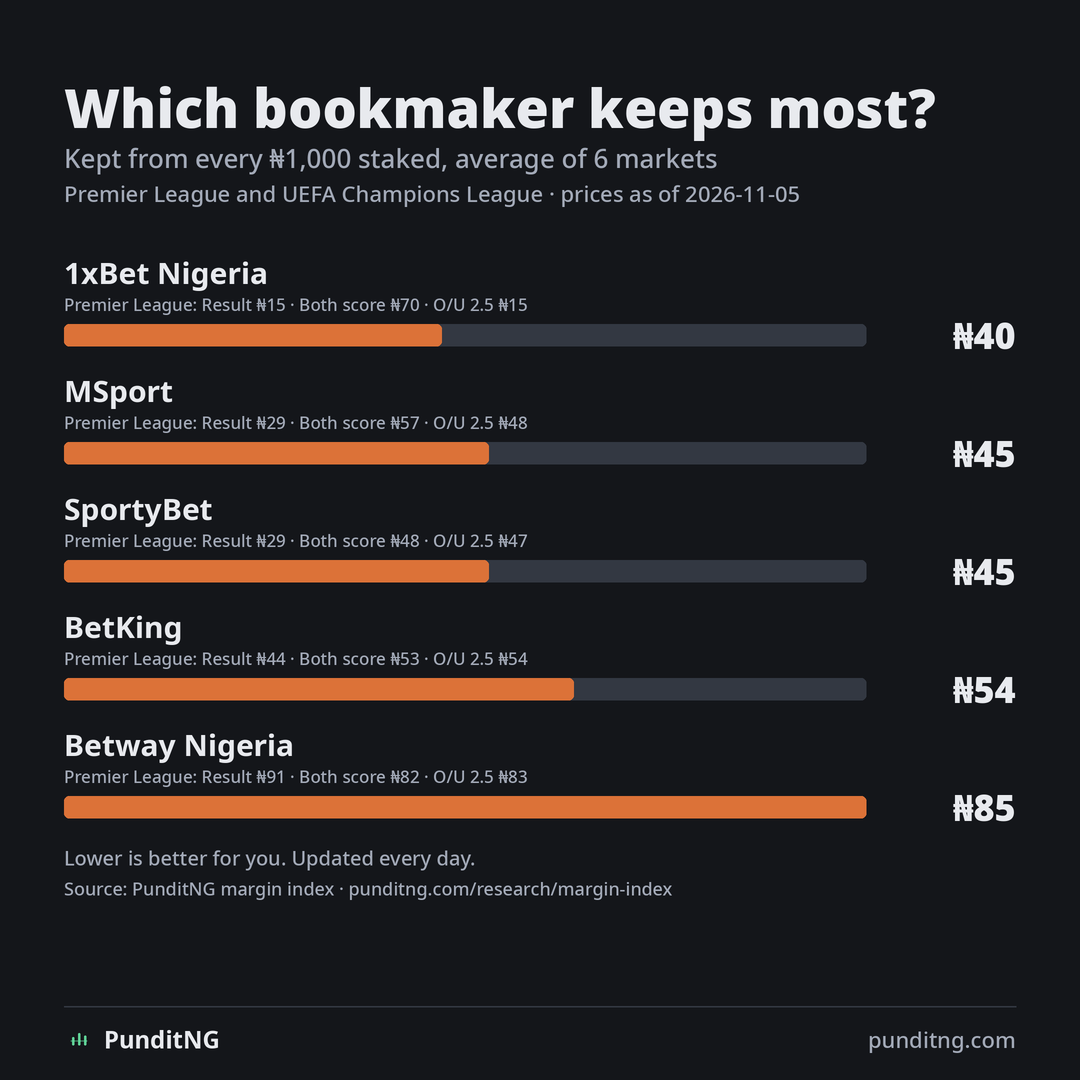
5 Nigerian bookmakers ranked, market by market, and what the gap costs over a season.
Studies
-
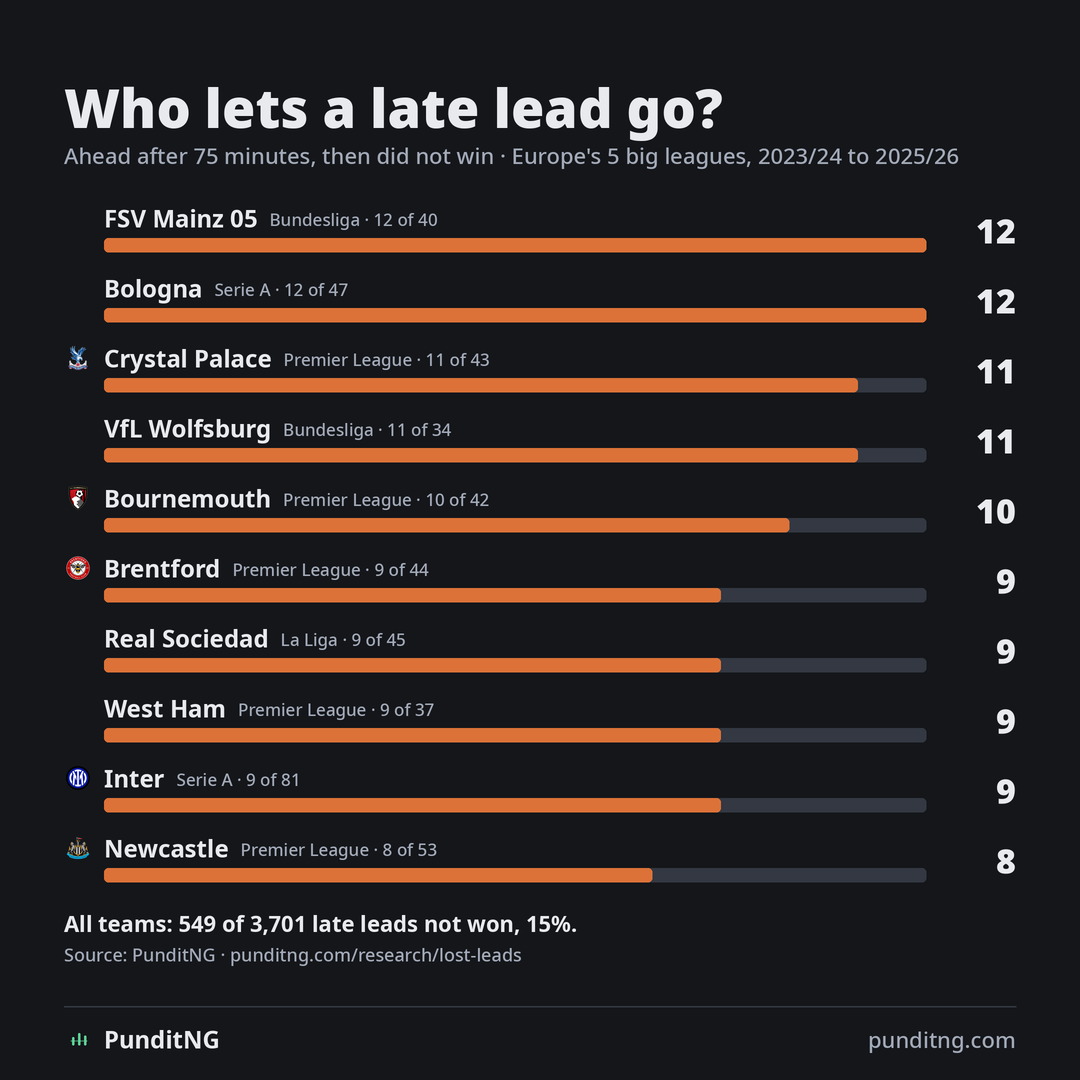
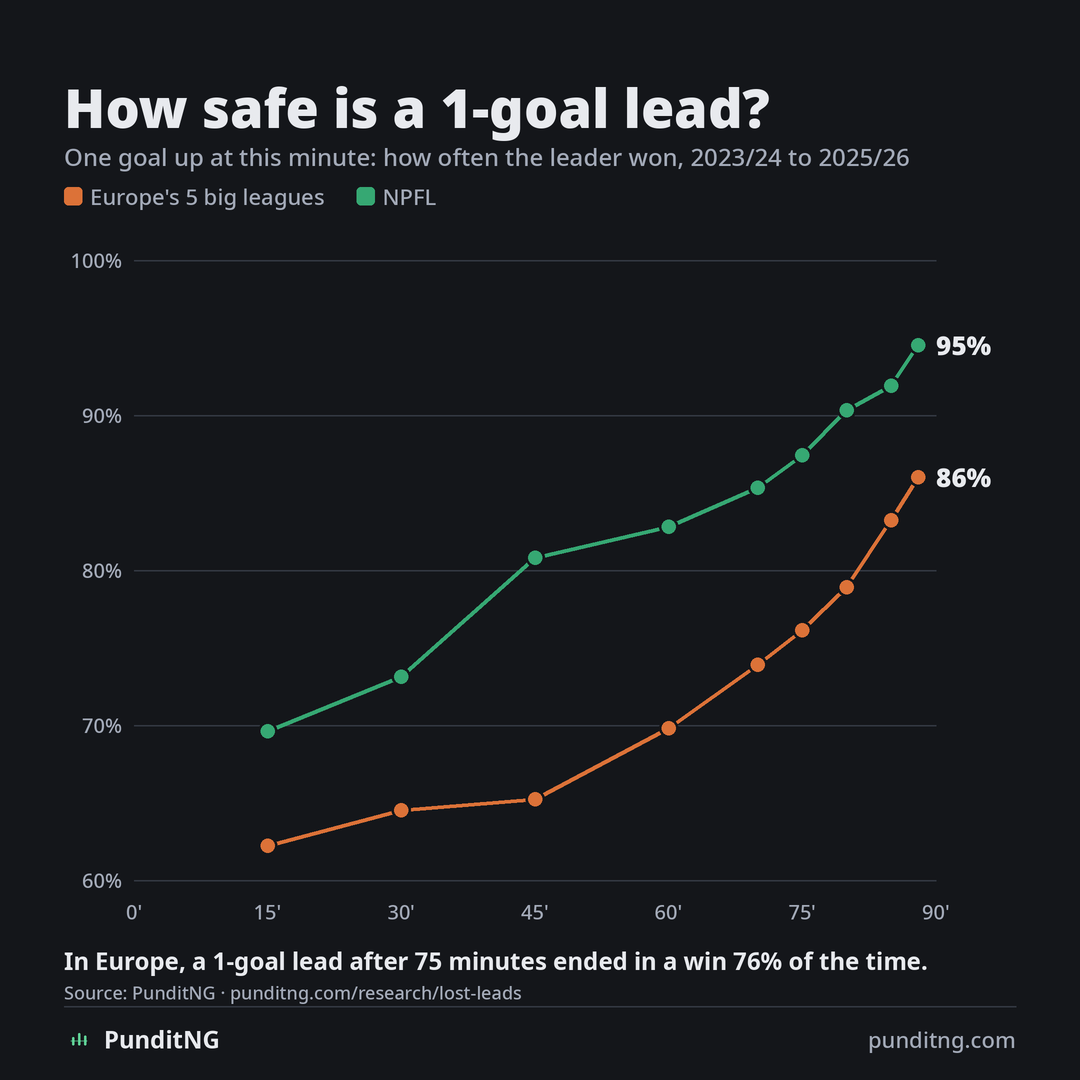
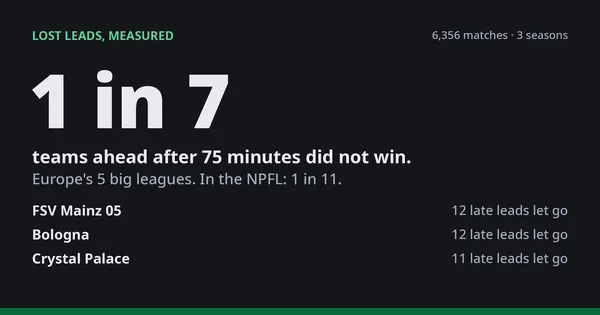 3 seasons, 6,356 matches Lost leads →
The teams that let it happen most and the safest, a one-goal lead minute by minute, and the NPFL against Europe.
Download: Teams chart · Minute chart · CSV
-
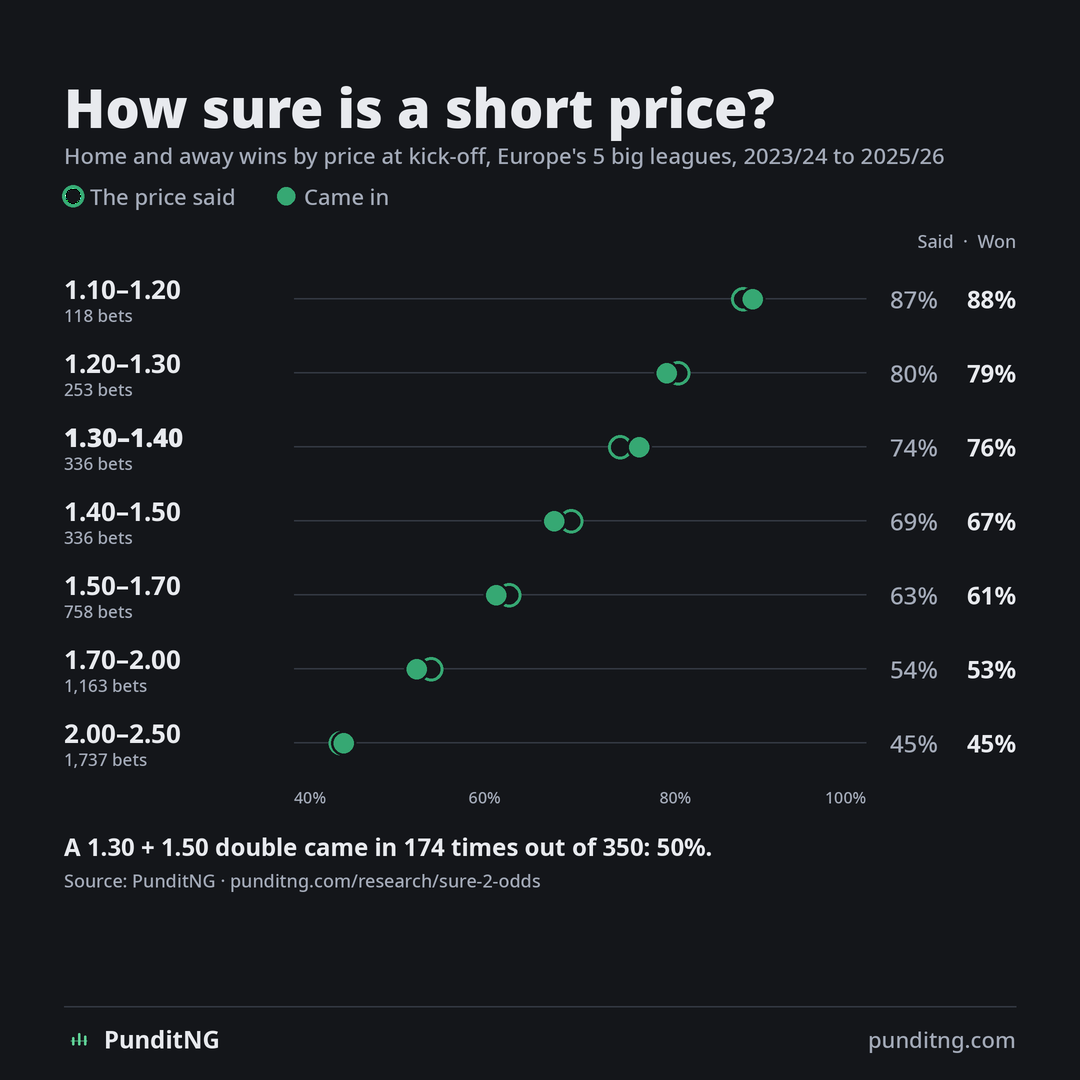
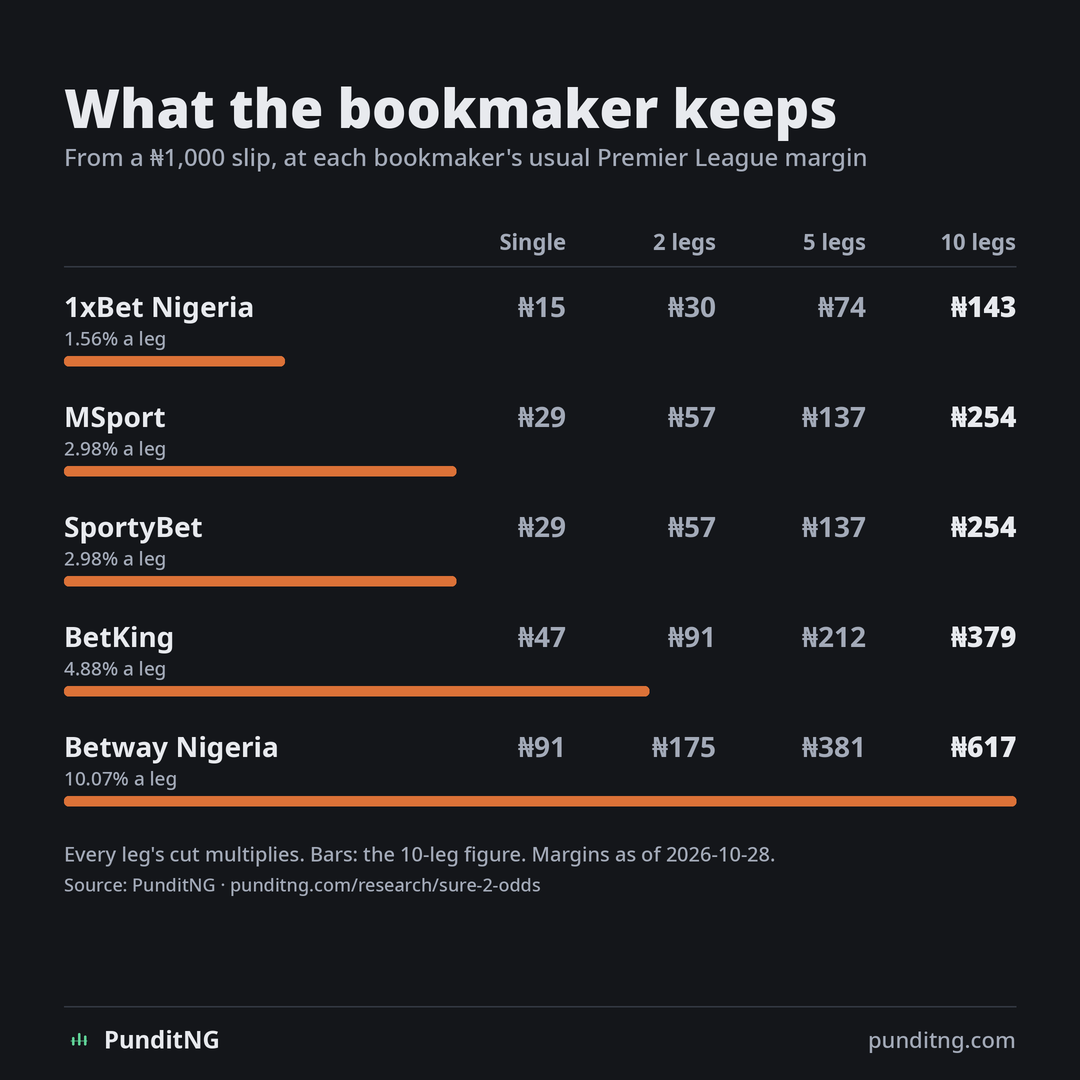
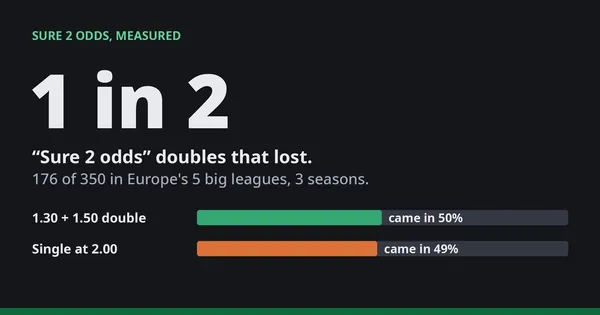 3 seasons, 5,256 matches Sure 2 odds, measured →
How often short prices really win, a double against a single, and what each bookmaker keeps on an accumulator.
Download: Prices chart · Accumulator chart · CSV
-
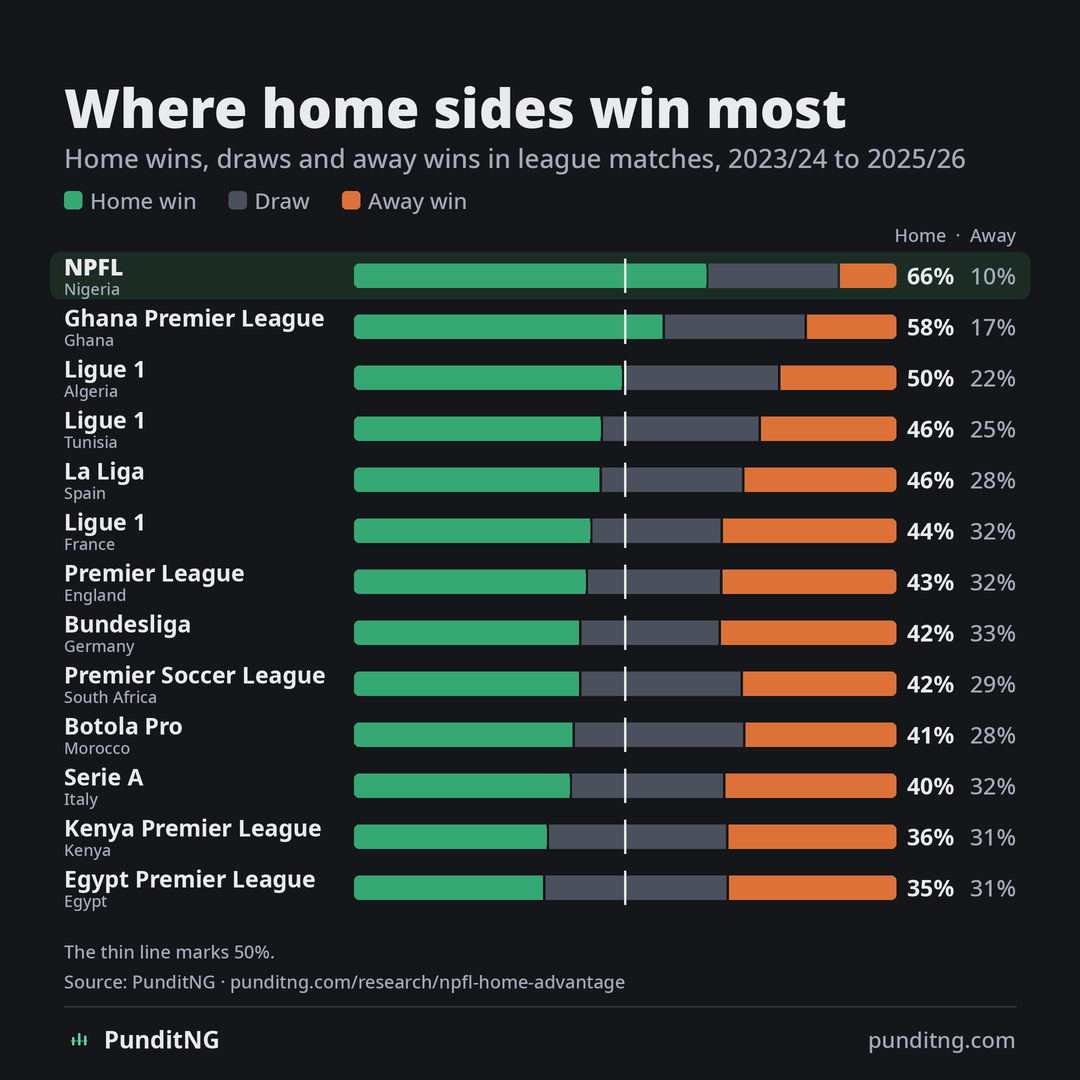
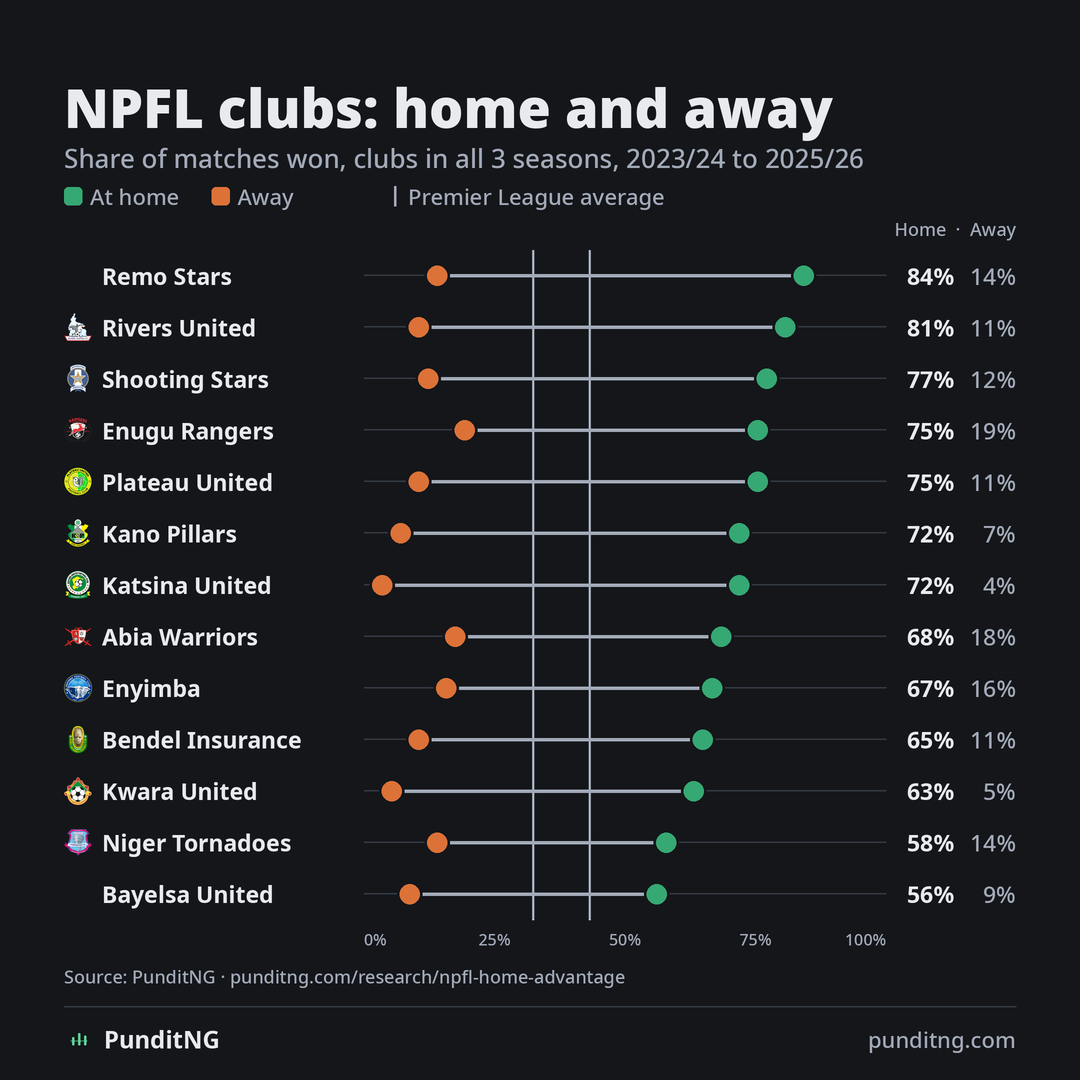
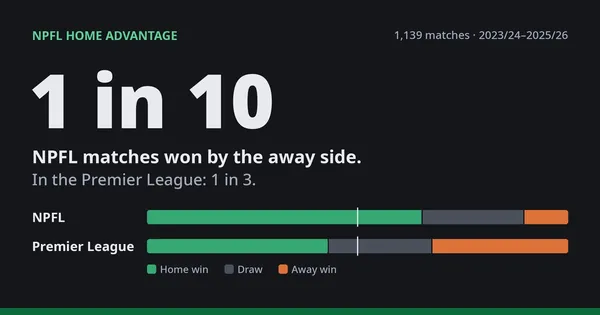 3 seasons, 11,894 matches NPFL home advantage →
The NPFL against 12 other leagues, club by club and season by season, and what bookmakers' prices said.
Download: Leagues chart · Clubs chart · CSV
For journalists and writers
- Free to use. Any figure or chart, in an article, a broadcast or a post, with a credit to PunditNG and a link to the page it comes from.
- Give the date for the pages that update: the margin index changes daily, the players abroad weekly.
- Charts are square, 1080 × 1080, sized for X, Facebook and WhatsApp. Each page also has its data as a CSV file.
- Need a number we have not published? One club, one fixture, one bookmaker: write to contact@punditng.com.
Credit line: Source: PunditNG, punditng.com
How we work
- Every figure is counted from results and prices, the same way for every club and every bookmaker.
- Every study says what it does not show, next to what it does.
- Some bookmakers pay us a commission for new customers. None can pay to change a number. See our methodology.